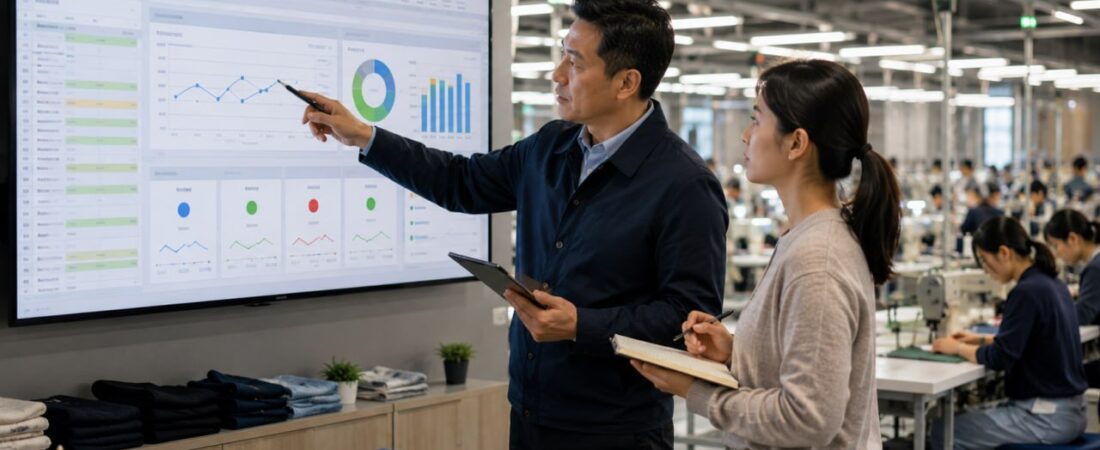
AI-Excel workflow ownership note
AI Excel becomes valuable when it turns messy factory data into a repeatable workflow, not when it only generates formulas. The practical test is whether the workbook can support a supervisor meeting, a line review, or a buyer evidence request without manual explanation every time.
Formulas improve before definitions are owned
The common mistake is to automate formulas while leaving definitions unstable. Output, efficiency, downtime, rework, absenteeism, and plan changes may all be recorded, but if each department defines them differently, the dashboard becomes a polished argument.
Checks before funding AI-assisted factory dashboards
- Are source files, field names, update timing, and correction rules defined before dashboard design?
- Does each KPI have an owner and an action rule when the number moves?
- Can AI explain the reason behind a chart using source rows, not only summarize the visible graph?
Proof requests for AI-Excel workflow tools
- Show how the tool handles missing values, duplicate rows, late updates, and changed column names.
- Provide an audit trail from dashboard number back to source records.
- Demonstrate a weekly factory review workflow using the workbook, not only a formula example.
Workbook-to-decision gate
GO if the workbook creates a repeatable decision meeting. HOLD if the data can be cleaned but ownership is unclear. REDESIGN if AI is being used to decorate a spreadsheet that no one trusts.
When many factory teams hear the phrase AI Excel, they immediately think about formulas.
The better approval question is whether the Excel workflow has controlled definitions, owner review, exception handling, and meeting rhythm before AI is asked to generate formulas or dashboard summaries.
They think about VLOOKUP, XLOOKUP, pivot tables, macros, Power Query, automated charts, and now AI-generated Excel formulas from tools like ChatGPT.
These tools are useful. Microsoft’s Excel support resources and Power Query documentation show how powerful spreadsheet workflows can become. But for manufacturing teams, the real value of AI Excel is not about creating more complicated formulas faster.
The real value is turning messy production data into a clear management workflow that people can actually use.
In other words, AI Excel is not just a formula assistant. It is a workflow design tool. This is the same readiness logic behind garment factory data problems that break AI projects: before a factory can automate decisions, it must first make the data structure understandable.
AI-Excel workflow article map
- Factories do not usually lack data
- Before full AI adoption, factories need KPI dashboards
- AI Excel should not be used only as a formula generator
- Messy production data cannot become a dashboard immediately
- A good dashboard must be explainable before it is beautiful
- The first step of Factory AI is not automation
- What AI-assisted KPI dashboards can actually do
- Factory AI does not mean abandoning Excel
Factories Do Not Usually Lack Data
Most factories already have data. They have daily production reports, line output records, manpower data, working hours, defect quantities, rework records, cutting reports, sewing input, inspection results, shipment schedules, material status, and delivery delay reasons.
The problem is usually not the absence of data. The problem is that the data is often scattered, inconsistent, and difficult to trust.
- Each department may use a different file format.
- Line names may not be written consistently.
- Style numbers may be entered in different ways.
- Dates may refer to production date, input date, inspection date, or shipment date.
- Defect data may be mixed with rework data.
- Production quantity may mean sewing output, QC-passed quantity, or packed quantity.
- Managers may ask for KPI reports that are not directly connected to the original input data.
If this kind of data is pushed into an AI tool without cleaning the workflow first, the result may look impressive on the surface. But the factory is not becoming smarter. It is only automating confusion.
Before Full AI Adoption, Factories Need KPI Dashboards
When people talk about AI adoption in manufacturing, they often imagine large systems: demand forecasting, automatic production planning, defect prediction, cost optimization, digital twins, or smart factory platforms.
These ideas are important. But for many real factories, they are not the first step. The first step is much more practical: build a KPI dashboard that the factory team can actually use every day.
A KPI dashboard is not just a visual report. A good dashboard forces the team to define the way the factory is managed.
- What numbers matter every day?
- Which data must be entered by the production team?
- What is the difference between normal and abnormal performance?
- Which department should respond when a KPI changes?
- Are managers and floor teams looking at the same numbers?
- Can the team explain where each KPI came from?
This is why an Excel-based KPI dashboard can be a realistic first step for Factory AI. It creates a common language before the company tries to build a larger AI system.
AI Excel Should Not Be Used Only as a Formula Generator
It is easy to ask AI questions like: “Create an Excel formula to calculate defect rate,” “Build a formula to summarize output by production line,” or “Tell me how to make a pivot table from this data.”
These are useful questions. But they are still formula-level questions. For factory management, better questions are different.
- How should this production report be structured so it can support a KPI dashboard?
- Which columns should be treated as raw data, and which should be calculated indicators?
- How can line productivity and defect rate be reviewed together?
- What input format would be easy for the floor team but still useful for management?
- Which KPI could mislead managers if the data definition is unclear?
- What exceptions should be separated before building the dashboard?
This is the shift that matters. The first approach uses AI as a formula generator. The second approach uses AI as a workflow design partner. For factory teams, the second approach is far more valuable.
Messy Production Data Cannot Become a Dashboard Immediately
Imagine a simple sewing line production file. It may include date, style number, line number, order quantity, manpower, working hours, daily output, defect quantity, rework quantity, cumulative output, and target achievement rate.
At first glance, this looks like enough data to create a dashboard. But before building charts, the team needs to ask several questions.
- What does the date mean: working date, report date, inspection date, or shipment date?
- What does production output mean: sewing completed quantity, QC-passed quantity, or packed quantity?
- Are defects counted only once, or are inline defects, final inspection defects, and re-inspection defects mixed together?
- Does manpower reflect actual working people, including absence, support workers, and partial-day workers?
- How was the production target set: by SAM, line balancing, operator skill, style difficulty, fabric behavior, or only a simple daily target?
These questions are not just technical details. They decide whether the dashboard reflects factory reality or creates a misleading picture. This is where AI Excel can help: it can review the logic behind the data before turning that data into management visuals.
A Good Dashboard Must Be Explainable Before It Is Beautiful
Many dashboard projects begin with design. People focus on colors, charts, cards, slicers, filters, and executive-style layouts. Visual design matters, but for factory management, the first requirement is not beauty. The first requirement is explainability.
A factory dashboard should help managers ask better questions. If Line 3 shows low productivity, the dashboard should not stop at saying that Line 3 is underperforming. It should help the manager investigate why.
- Is the issue caused by manpower shortage?
- Is the style more difficult than other styles?
- Was there a fabric or trim problem?
- Did defects and rework reduce effective output?
- Was the target unrealistic?
- Is this a one-day issue or a weekly trend?
- Are other lines producing the same style under similar conditions?
- Is the bottleneck related to cutting, sewing, finishing, or inspection?
This is the difference between a reporting dashboard and a management dashboard. A reporting dashboard shows numbers. A management dashboard helps people understand what to do next.
The First Step of Factory AI Is Not Automation
In manufacturing, many people think AI adoption starts with automation. But in reality, the first step is often not automation. The first step is organization.
- Data fields
- Input formats
- KPI definitions
- Department terminology
- Exception rules
- Reporting flows
- Decision criteria
- Review routines
Without this foundation, AI can generate outputs, but those outputs may not be safe for real operational decisions. In a factory, one number can influence production instructions, manpower allocation, shipment planning, buyer communication, cost decisions, and delivery risk management.
A factory should not only ask: “Can AI calculate this?” It should also ask: “Can our team explain this number, trust this number, and act on this number?”
What AI-Assisted KPI Dashboards Can Actually Do
An AI-assisted KPI dashboard is different from a normal Excel report. A traditional Excel report depends heavily on manual input, manual calculation, and manual interpretation.
An AI-assisted workflow can support the team in several practical ways.
- Reviewing the structure of raw production data
- Detecting missing or abnormal values
- Suggesting KPI definitions
- Standardizing department input fields
- Separating raw data from calculated indicators
- Creating weekly management summaries
- Listing possible reasons behind poor performance
- Preparing review questions for production meetings
- Drafting action items for improvement follow-up
However, AI should not replace factory judgment. The purpose of AI is not to remove human responsibility from factory management. The purpose is to help the team see faster, question more consistently, and explain decisions more clearly.
In this sense, AI-assisted dashboards are not only about efficiency. They are about management quality.
Factory AI Does Not Mean Abandoning Excel
Many factories still run on Excel. This is not necessarily a weakness. Excel is familiar, flexible, accessible to managers and staff, easy to change quickly, and useful before the company invests in a full system.
The real problem is not Excel itself. The problem is when Excel remains a collection of disconnected personal files and manual reports.
In the AI era, Excel needs to evolve. Traditional Excel was mainly about input and calculation. AI Excel should move toward data structure design, KPI logic definition, report automation, exception explanation, management review support, decision workflow documentation, and continuous improvement follow-up.
This is a realistic path for many factories. They do not jump directly from manual reports to full AI systems. They start from Excel. Then, if the Excel workflow is designed properly, it becomes the foundation for dashboards, databases, automation, and eventually more advanced AI applications. It also supports the practical roadmap described in AI factories start with RFID, not robots.
Final AI-Excel workflow takeaway
The most common AI Excel question is: “Which formula should I use?” But for factory AI, the better question is: “Does this data workflow explain how our factory actually operates?”
Formulas are necessary. Charts are useful. Automation is valuable. But before all of that, factories need workflow design.
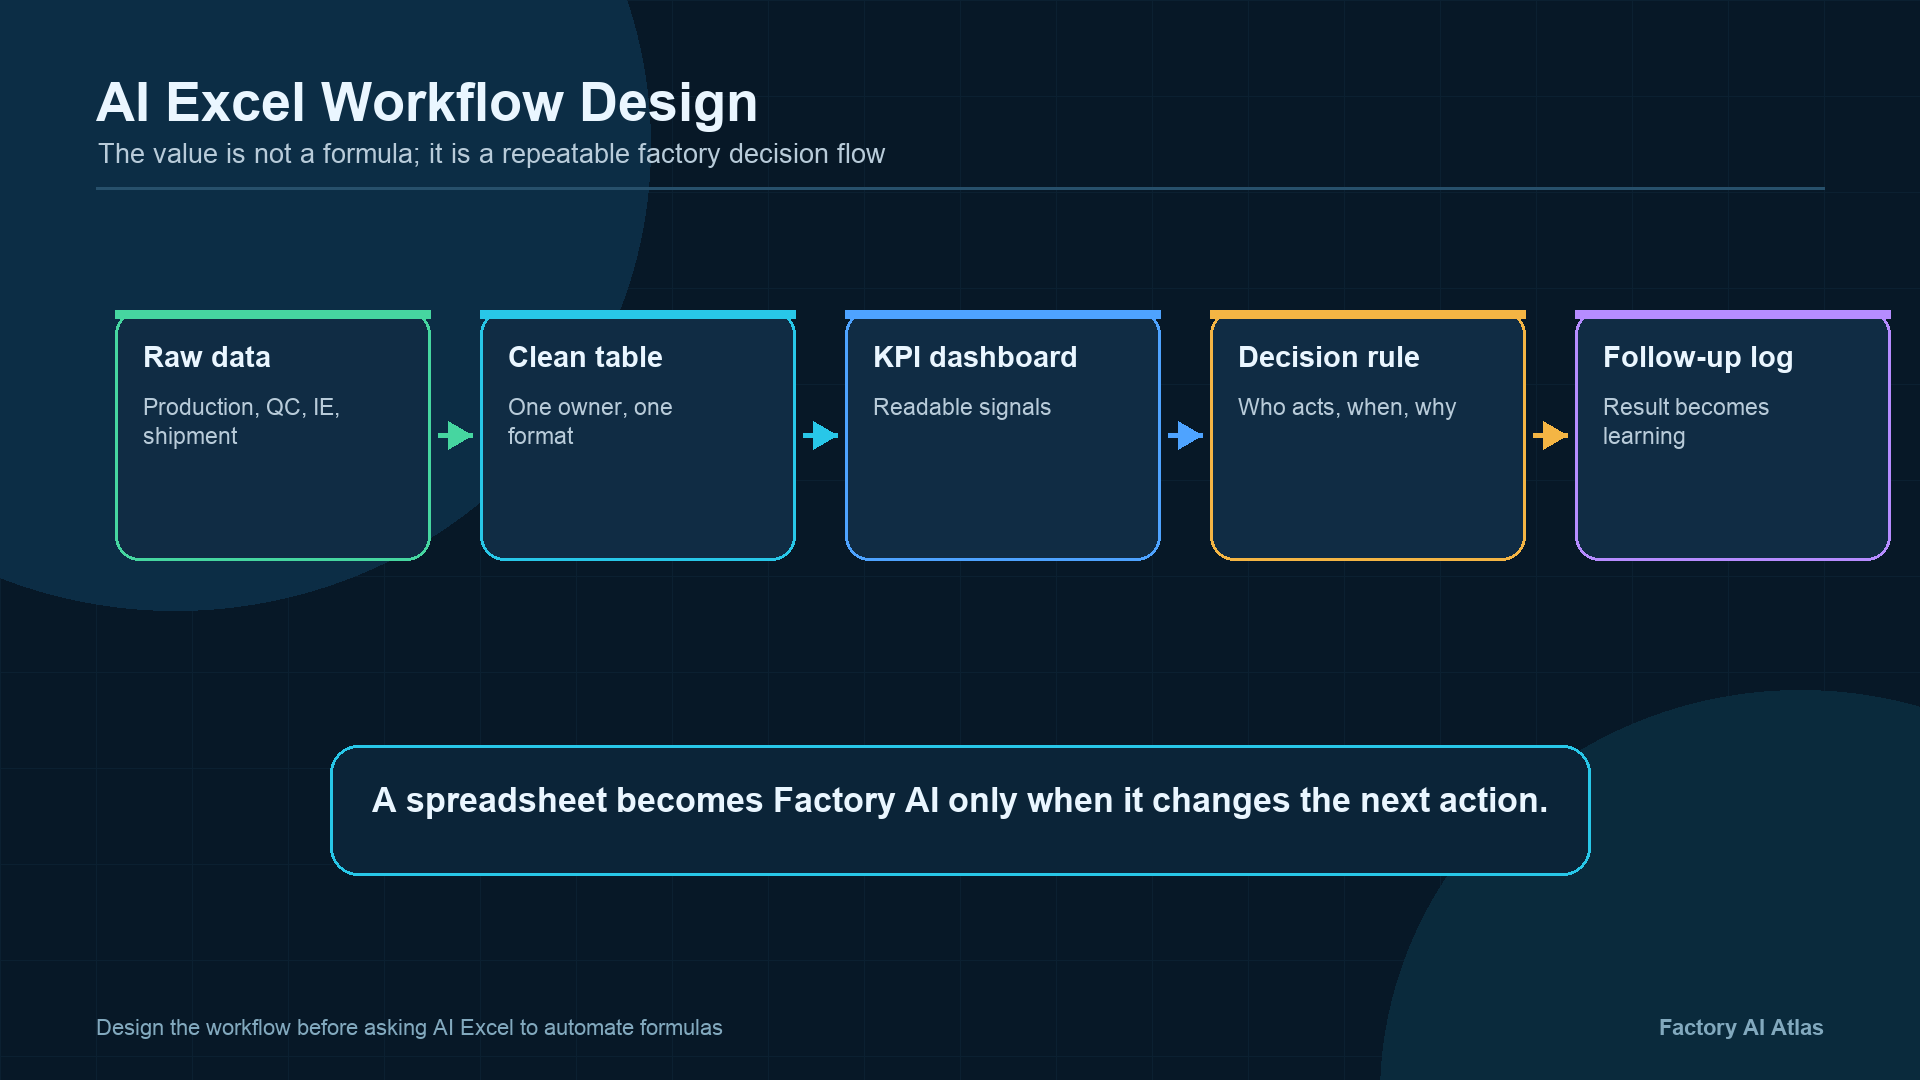
Daily production data should connect to management KPIs. KPIs should connect to root-cause questions. Root-cause questions should connect to improvement actions.
When this flow is clear, Excel becomes more than an office tool. It becomes the first operating layer of Factory AI.
AI Excel is not about formulas. AI Excel is about turning factory data into clean, explainable, decision-ready workflows.
Evan Lee factory field note
Excel problems are usually ownership problems
In many factories, the problem is not that Excel is too simple. The problem is that the file owner, update timing, exception rule, approval path, and version discipline are unclear. AI can summarize or generate formulas, but it cannot fix a workflow where teams do not agree which file is the operating truth.
External validation anchors for AI-assisted factory dashboards
- NIST AI Risk Management Framework — helpful for keeping AI-assisted spreadsheet workflows accountable and explainable.
- NIST manufacturing resources — useful context for connecting spreadsheets to manufacturing operations rather than isolated reporting.