Map the factory AI stack before comparing vendors.
Market maps help factory teams understand which layer they are really evaluating: chips, edge AI, sensors, machines, robots, factory systems, or the people who must operate the process after the vendor leaves.
New map layer
Semantic and human-data layers sit underneath any automation map.
Factory AI semantic maps
Map WIP, hold areas, rework carts, packing status, and movement meaning before adding more AI agents or robots.
Read semantic map →Operator skill matrix
Connect automation roadmaps to operator capability, training gaps, flexibility, and line-balancing reality.
Read skill matrix →See the factory AI stack before comparing products.
This landscape turns the market map into a visible stack: chips, edge data capture, robots and machines, factory systems, and the human operating layer.
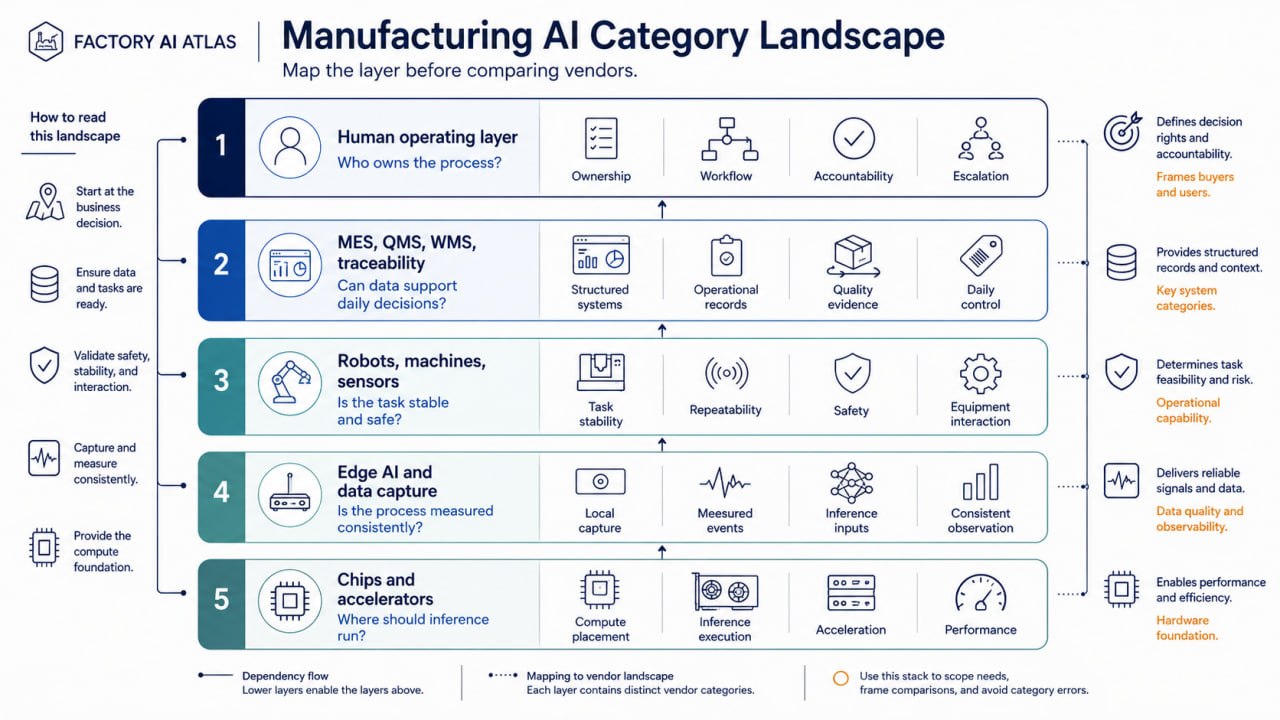
Use market maps to define the layer, not to chase a logo list.
Factory AI Atlas does not treat market maps as pay-to-play vendor rankings. The practical value is to identify the pilot boundary, data requirement, process owner, and risk level before a team compares products.
Clarify the layer
Is the problem about inference hardware, sensor capture, machine control, factory software, or operating ownership?
Clarify the decision
Should the team invest, run a small pilot, improve data first, or reject the proposed category for now?
Clarify the evidence
What proof is needed under the factory’s actual materials, routes, safety rules, QC tolerances, and line conditions?
Chips → edge → robots → factory systems → people.
A factory AI project usually fails when teams buy one layer while the bottleneck is actually in another layer.
Three practical market maps for the current Atlas stage.
These maps keep the site focused on manufacturing readiness, not generic AI market commentary.
Factory AI Stack Map
Connect infrastructure to shop-floor decisions: chips, edge AI, sensors, machines, factory systems, and people.
Explore stack →Mobile Robot Map
Separate AGVs, AMRs, cleaning robots, patrol robots, and automated forklifts by route control and safety boundary.
Read mobile robot map →Garment Automation Map
Map cutting, sewing assistance, WIP tracking, QC, finishing, packing, traceability, and training as separate readiness layers.
Read garment stack →Ask these questions before a vendor comparison.
The map is useful only if it changes the buying conversation.
Hardware, sensing, robot motion, factory software, or operational change?
Does the data exist, and is it trusted by production and QC teams?
Can the pilot run inside a defined zone, route, task, or product family?
What evidence triggers scale-up, rework, or stop?
In apparel factories, the map must separate data readiness from robot ambition.
Garment automation often breaks when teams jump from a robot demo to sewing complexity without first strengthening WIP visibility, standard-time data, QC feedback, traceability, style-changeover control, and operator decision support.
- Cutting, sewing, finishing, packing, and QC are different automation problems.
- GSD, SAM, and SMV can act as a standard-time data layer.
- Traceability and control-point digitization are often safer first readiness moves than advanced robots.
Start from the operating question.
Do not ask, “Which vendor is best?” first. Ask, “Which factory layer is blocking the outcome we need?” Then use the map to choose the smallest credible pilot.
Read the apparel automation roadmap →Use the maps with readiness and checklist pages.
Market maps should route readers into practical decisions, not stop at category definitions.
Physical AI guide
Understand how physical AI connects perception, action, and factory environments.
Read guide →GSD, SAM, SMV data layer
Connect apparel standard-time work to Factory AI data readiness.
Read article →Market maps help define the layer before comparing vendors.
These maps are not pay-to-play vendor rankings. They help readers separate chips, edge AI, sensors, robots, workflow software, factory systems, and human operating routines before a pilot or procurement conversation begins.
Decision value
A map should clarify what evidence the factory needs: data readiness, route discipline, maintenance ownership, safety boundaries, operator workflow, and ROI assumptions.
Apparel stress test
Garment factories make the distinction visible because style variation, line balancing, standard time, quality controls, and material behavior often break simple automation claims.
Use the map to choose a smaller, safer pilot.
A good market map does not make the factory buy faster. It helps the team ask better questions before money, time, and credibility are committed.
Decision map
Factory AI market maps should separate technology categories by the factory decision they support.
A useful factory AI market map is not just a vendor list. It should explain where the tool touches production data, quality evidence, operator work, maintenance ownership, and ROI risk. Factory AI Atlas uses the following practical layers when reviewing the market.
1. Visibility layer
Cameras, RFID/QR labels, WIP scans, sensors, line-status records, and exception logs. The question is whether the factory can see work accurately before automating decisions.
2. Decision layer
Scheduling, defect triage, maintenance priority, cutting-plan adjustments, line-balance signals, and buyer-evidence preparation. The question is who acts on the recommendation and when.
3. Execution layer
Robots, AGVs/AMRs, smart machines, edge devices, and workflow agents. The question is whether safety, downtime, changeover, and ownership are ready for controlled execution.
4. Evidence layer
Audit trails, traceability records, standard-time data, quality evidence, and ROI baselines. The question is whether the result can be trusted by management, buyers, and operations teams.
Editorial note: Market maps are expanded only when the category has enough decision criteria to help a factory team compare options. Thin vendor-list pages are avoided because they create weak content value for readers.