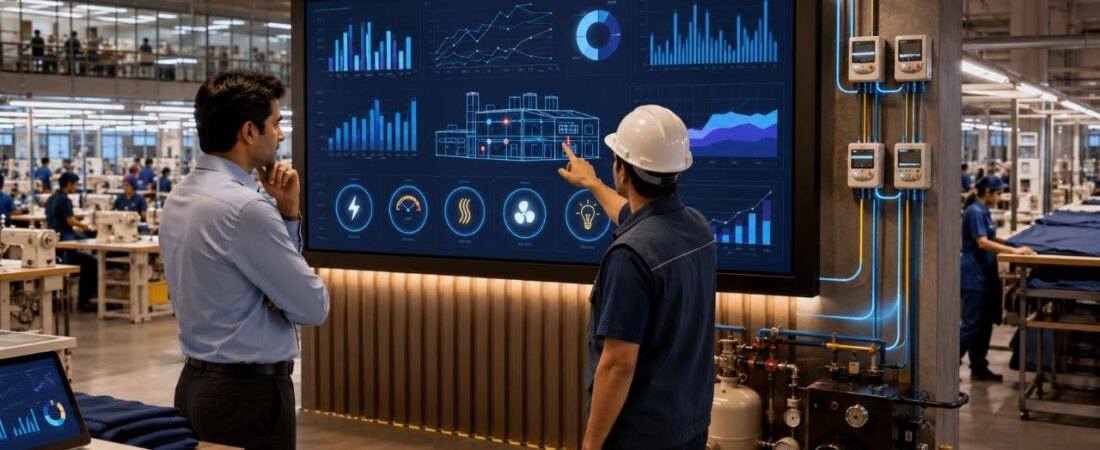
Energy-data decision note
Factory energy data becomes useful for AI only when it changes operating decisions, not when it merely explains the utility bill. The factory should connect energy signals to machine use, compressed air leakage, HVAC zones, peak demand, production output, and maintenance behavior.
Monthly bills hide operating waste
The common mistake is to review energy as a monthly finance number. By the time the bill arrives, the factory has already lost the chance to correct idle running, compressed-air leakage, shift-level peaks, boiler waste, or line-level consumption patterns.
Checks before funding energy analytics
- Can energy use be separated by time block, line, machine group, compressor, HVAC zone, or production area?
- Can the factory explain energy per output unit, not only total consumption?
- Who owns the corrective action when the data shows peak demand, leakage, idle running, or abnormal load?
Vendor proof for energy actionability
- Show energy data connected to production output, machine state, and peak-demand events.
- Demonstrate alert logic for compressed air, HVAC, lighting, boiler, or abnormal idle-load signals.
- Provide a savings evidence trail that separates operational savings from tariff or weather effects.
Energy-saving evidence gate
GO if energy data creates a fixable factory action. HOLD if metering exists but cause ownership is unclear. REDESIGN if the system produces dashboards without operational accountability.
Factory energy data is one of the hidden cost layers that factory AI must understand before it can reduce utility waste, predict peak demand, or connect production scheduling with energy cost.
Most factory AI discussions begin with robots, dashboards, predictive models, or real-time optimization. But one of the most important operating layers in a factory is often still measured too broadly: energy.
Many factories know their monthly electricity bill. Some know their total utility cost. Fewer know which line, process, time block, machine group, or operating habit created that cost.
That difference matters. A monthly utility bill is useful for accounting. It is not enough for factory AI.
If a factory wants AI to reduce energy waste, detect abnormal consumption, forecast peak demand, or link production scheduling with utility cost, it needs a basic energy data layer first. Without that layer, AI can only make generic recommendations. It cannot understand the real factory.
Factory energy data is the hidden cost layer AI should understand before any serious energy optimization project begins. In practical terms, factory energy data turns a utility bill into a management signal.
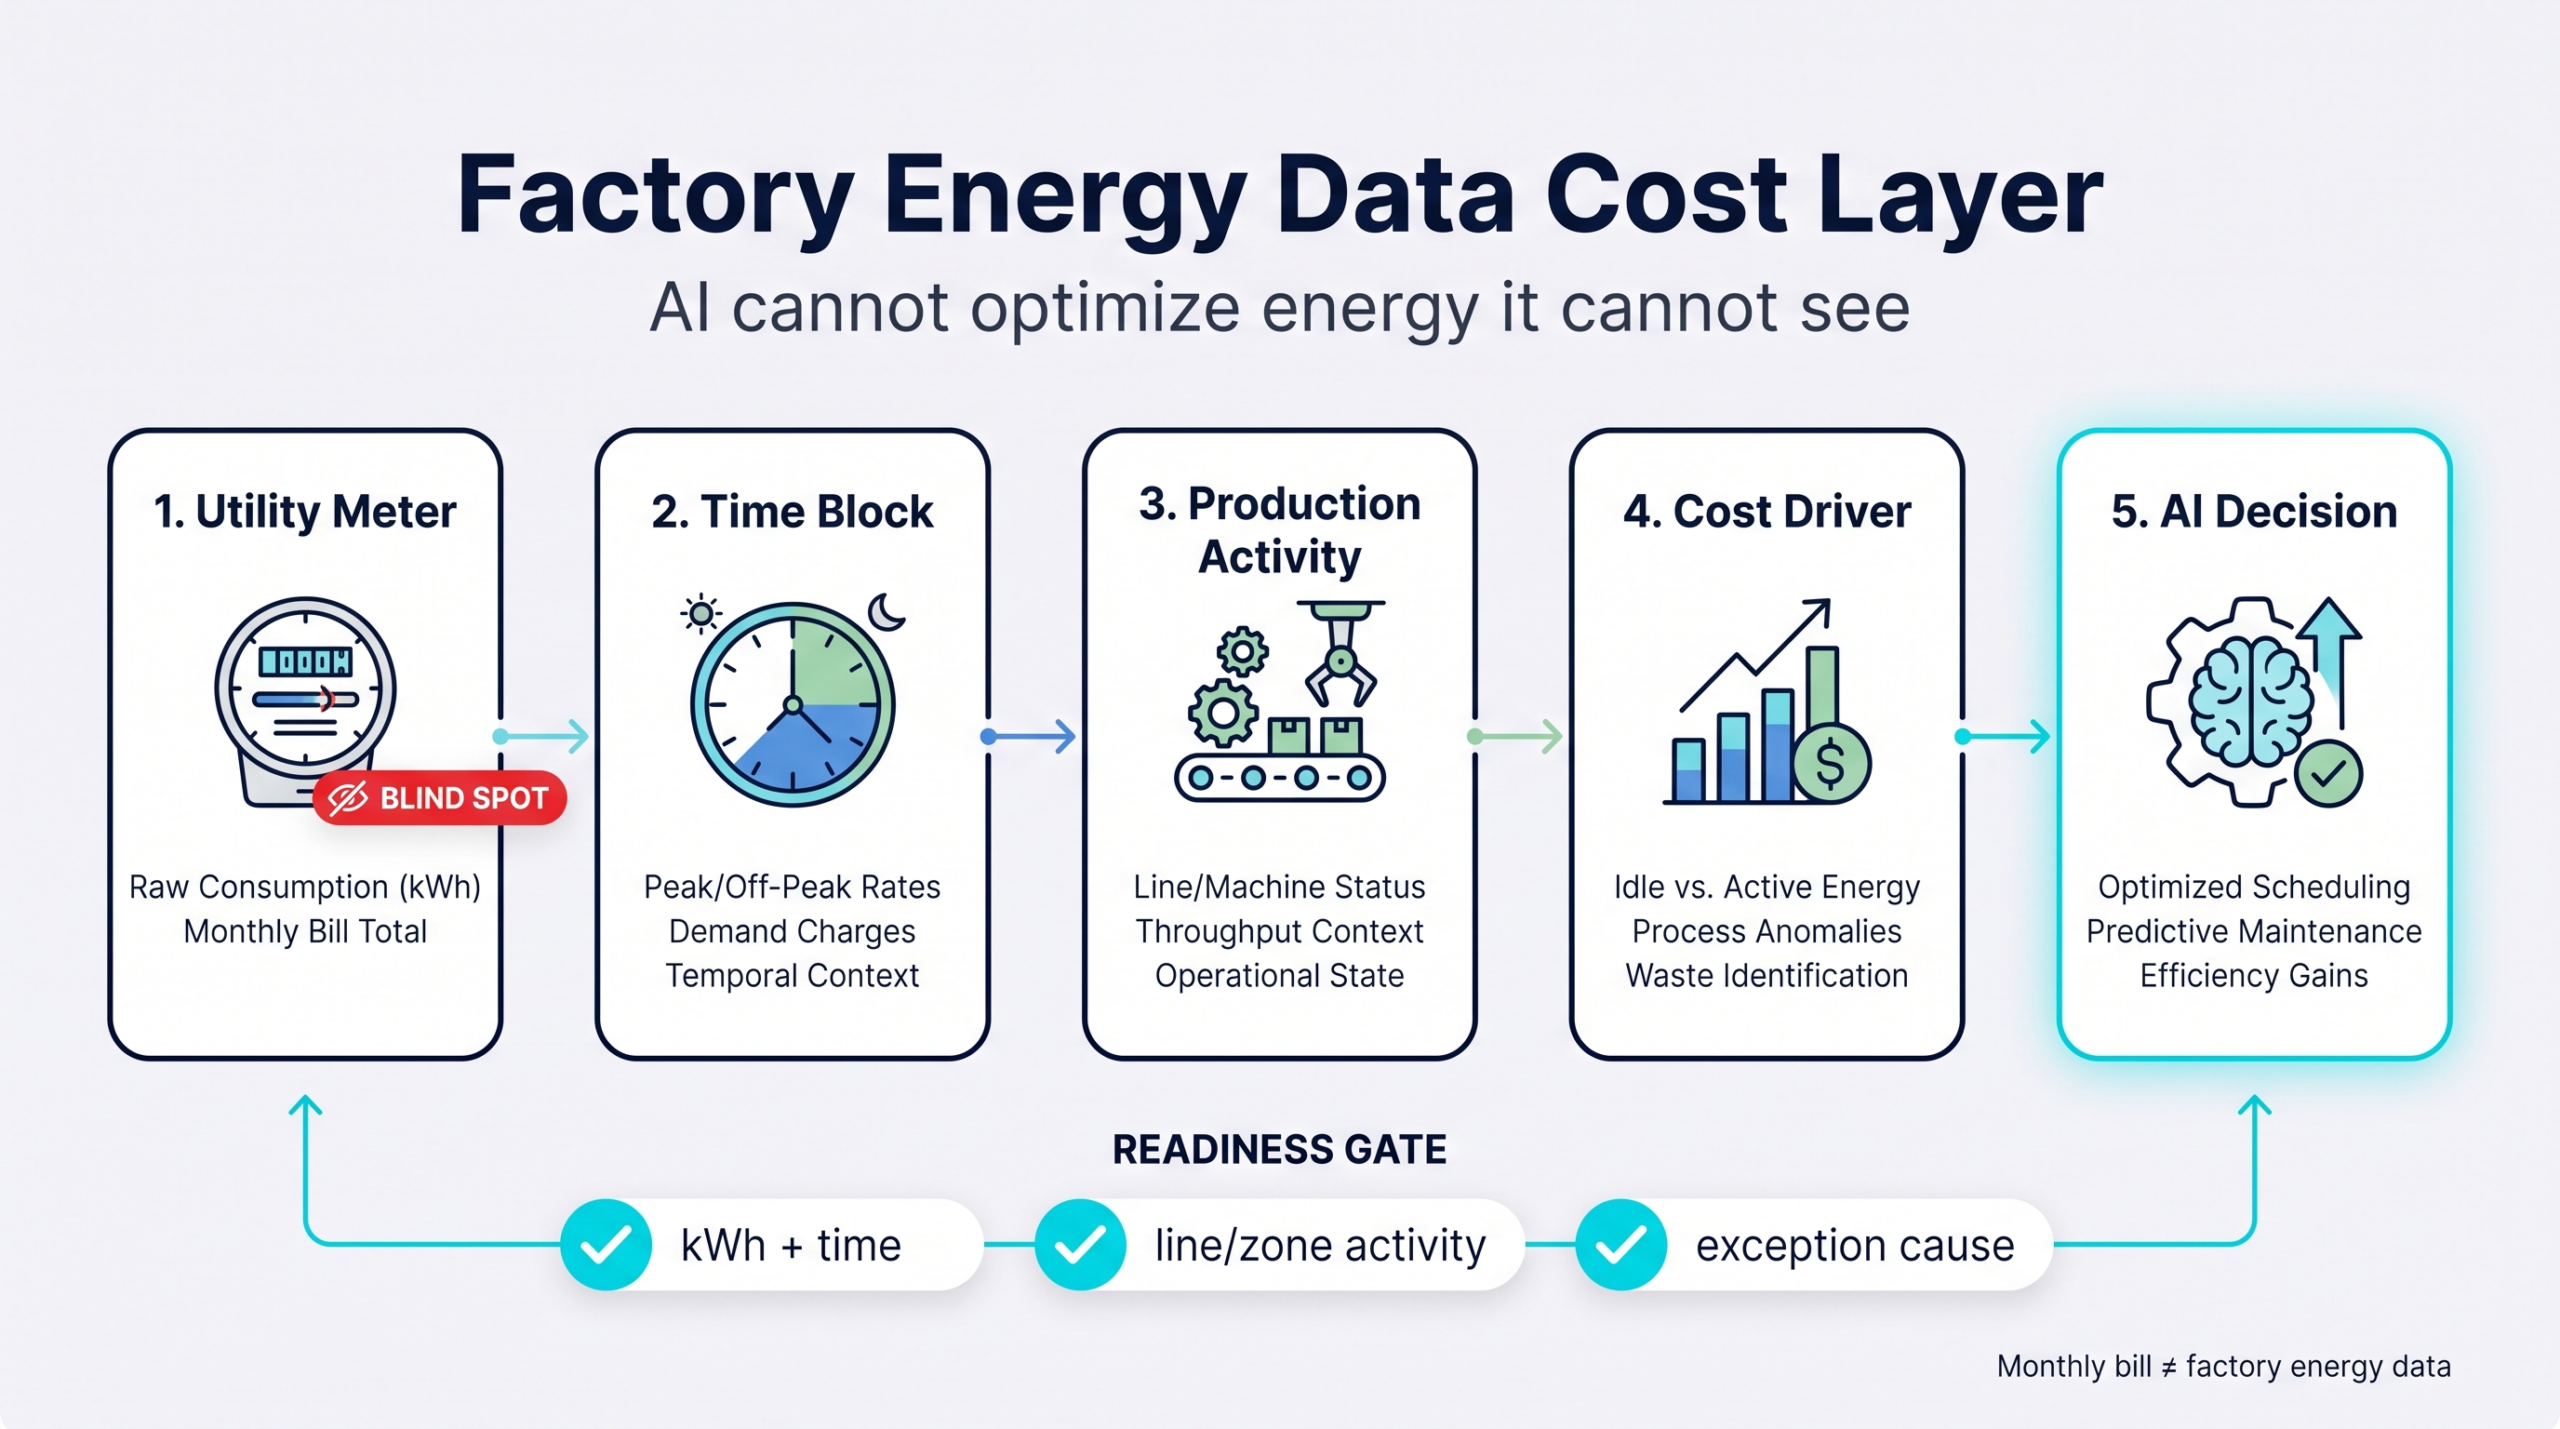
AI Cannot Optimize Energy It Cannot See
AI does not reduce energy cost by magic. It needs signals.
In many factories, energy data is still collected at the building or monthly billing level. The finance team may know the monthly electricity cost. The maintenance team may know when the compressor failed. The production team may know which line worked overtime. But these data points are often separated.
That separation creates a problem. If energy consumption rises, the factory may not know whether the cause was higher production volume, overtime work, compressed air leakage, inefficient machine standby, poor scheduling, HVAC load, boiler waste, or a maintenance issue.
From an AI perspective, this is not an optimization problem yet. It is a visibility problem.
Before a factory asks AI to reduce energy cost, it must first answer a simpler question: can we see where, when, and why energy is being used?
Monthly Utility Bills Are Not Factory Energy Data
A monthly utility bill shows what the factory paid. It does not show how the factory behaved.
For factory AI, that distinction is critical. A monthly bill usually provides total cost, total consumption, billing period, tariff information, and maybe peak demand. But factory operations happen at a much more detailed level.
Production changes by shift. Lines start and stop. Styles change. Operators wait. Machines stay on during idle time. Compressors run even when leaks are hidden. Finishing equipment consumes heat. Lighting and cooling loads shift by area and time of day.
A monthly bill cannot explain these patterns. Factory energy data should be connected to operations. It should help teams understand energy by time block, production area, machine group, line, process, output, shift, and avoidable delay.
Only then can energy move from accounting data to operational data. This is where factory energy data becomes useful for managers, not only accountants.
7 Factory Energy Data Points AI Needs Before Cost Reduction
A factory does not need a perfect smart energy platform on day one. But it does need a practical starting structure. These seven factory energy data points make energy visible enough for future AI use.
1. Total Electricity Use by Time Block
The first step is to move from monthly totals to time-based energy patterns. Factories should try to capture electricity use by hour, shift, day, production period, or 15-minute interval where possible.
This helps the factory see when energy demand rises. A garment factory may discover that electricity peaks during cutting room operation, finishing work, overtime sewing, or simultaneous use of compressors, lighting, and HVAC.
The goal is not just to know how much energy was used. The goal is to know when energy pressure appears.
In some regions, this time-block structure is already visible in the electricity tariff itself. For example, factories in parts of Vietnam, including the Ho Chi Minh City industrial area, may see electricity charges separated into peak time, normal time, and off-peak time depending on voltage level and customer category.
This is a useful regional example, not a country-specific rule. The important factory energy data lesson is that a factory should record the tariff category together with the time block, production activity, voltage or load group, and operating cause. The same kWh can create a different cost impact if it occurs during peak time instead of off-peak time.
- Peak time: often the most expensive production window
- Normal time: the standard operating cost window
- Off-peak time: usually the lower-cost night or low-demand window
2. Machine or Line-Level Consumption
Total factory energy is too broad for operational improvement. A better question is: which machines, lines, or production zones are responsible for the energy pattern?
Machine-level data may not be available immediately. In that case, factories can start with zone-level or process-level measurement. Useful groupings include cutting room, sewing floor, finishing area, pressing section, packing area, compressor room, boiler area, warehouse, office, and non-production loads.
For AI, this matters because energy cost must eventually be connected to operational decisions. If the factory cannot separate production energy from general building energy, AI cannot accurately recommend process improvements.
3. Compressed Air Usage and Leakage Signals
Compressed air is one of the most overlooked energy layers in labor-intensive factories. The U.S. Department of Energy treats compressed air as a major industrial system because it often carries large efficiency losses when poorly managed.
In apparel and light manufacturing environments, compressed air may support pneumatic tools, trimming equipment, cleaning, finishing tools, automatic attachments, pressing tables, and certain machine operations.
The problem is that compressed air waste is often invisible. A leak may continue for weeks. A compressor may run during idle periods. Air pressure may be set higher than needed because the root cause of poor delivery is not investigated.
Factories should track compressor operating hours, pressure drops, unusual cycling, air leak checks, maintenance records, and air usage by area if available. AI can later help detect abnormal patterns. But first, the factory must make compressed air visible.
4. Heat, Steam, Boiler, or Process Energy
Not every factory energy issue is electrical. In garment and textile-related operations, heat may appear in fusing, pressing, ironing, washing, drying, curing, steam generation, and finishing processes.
If heat energy is not tracked separately, the factory may miss a major cost layer. A finishing section may consume more energy during rework-heavy periods. A boiler may run inefficiently because production planning creates uneven demand. A fusing machine may remain heated during idle time.
The key question is simple: can the factory connect heat or steam use to actual production activity? If not, AI cannot distinguish necessary energy from avoidable waste.
5. HVAC and Lighting Load by Zone
Factories often treat cooling, ventilation, and lighting as background costs. But for many labor-intensive factories, these loads can be significant.
In garment factories, sewing areas may require large floor lighting. Finishing areas may produce heat. Offices, sample rooms, and warehouses may have different cooling patterns. Overtime work may extend lighting and HVAC hours even when output is low.
Factories should begin mapping lighting zones, HVAC zones, working hours by zone, overtime energy impact, non-production energy use, and abnormal usage outside operating hours. This does not require advanced AI at the beginning. It requires a practical zone map and basic time-based measurement.
6. Production Output Linked to Energy Use
Total energy consumption can be misleading. A high-energy day is not automatically a bad day. It may also be a high-output day.
The better question is: how much energy was used per unit of useful output?
Factories can begin by connecting factory energy data to output quantity, standard hours, style type, production line, working hours, rework volume, overtime, and machine downtime. This creates a more realistic view.
For example, two sewing lines may use similar energy, but one line may produce more output with fewer stoppages. A finishing area may consume more energy because rework increased. A cutting room may show high energy use because of poor scheduling and machine standby time, not because of actual cutting volume.
Energy data becomes useful when it is connected to production reality. This is similar to the broader data discipline discussed in Garment Factory Data Problems That Break AI Projects.
7. Peak Demand Events and Operational Causes
Peak demand can be expensive. But many factories only see it after the bill arrives.
Factory AI can eventually help predict or reduce peak demand. But before that, the factory must record what caused peak events. What time did the peak occur? Which departments were operating? Was there overtime? Were cutting, finishing, compressors, and HVAC loads active at the same time? Was equipment restarted after downtime?
Peak demand is not only an energy issue. It is often a planning issue. That is why energy data should connect with production schedules, maintenance events, and line activity.
Garment Factory Example: Energy Waste Is Often Hidden
Garment factories are often described as labor-intensive. That is true, but it can hide the importance of energy data.
A garment factory may not use the same energy profile as a heavy manufacturing plant. But it still has many hidden utility layers: sewing floor lighting, compressors, fusing machines, pressing equipment, boilers, vacuum tables, cutting machines, needle detectors, HVAC, fans, conveyors, and standby equipment.
The biggest waste may not come from one large machine. It may come from many small losses repeated every day.
- Machines left on during meal breaks
- Compressors running after production ends
- Poor lighting zone control
- Overtime work extending full-floor energy use
- Finishing equipment heated before materials are ready
- Rework increasing pressing and inspection energy
- Poor scheduling creating avoidable peak demand
This is why energy data must be designed around factory behavior, not just utility bills.
Energy Data Must Connect Maintenance, Production, and Finance
Energy cost is not owned by one department. Finance sees the bill. Maintenance sees the machines. Production creates the operating pattern. Management sees the margin impact.
If these teams use separate data, energy improvement becomes difficult. For AI readiness, the factory needs a shared structure: finance should know the cost impact, maintenance should know equipment behavior, production should know operational causes, and management should know which actions reduce waste.
A factory energy data layer does not need to be complicated at first. But it should create one shared view of energy use and factory activity. That shared view is what makes future AI useful.
This is also why factory AI readiness measurements should include utility signals, not only layout, walking distance, WIP, or machine spacing.
What AI Can Do Later
Once energy data becomes structured, AI use cases become more realistic.
- Peak demand prediction
- Abnormal energy use detection
- Compressed air leak pattern detection
- Standby energy alerts
- Energy cost per style estimation
- Production schedule energy simulation
- Maintenance-related energy loss analysis
- Zone-level utility waste ranking
But these use cases depend on data quality. If the factory only has monthly bills, AI can only provide high-level advice. If the factory has time-based, process-based, and production-linked energy data, AI can begin to support real operational decisions.
The sequence should be simple: first measure, then classify, then connect, then optimize.
This is the same practical mindset behind an AI garment factory dashboard: the dashboard is only useful when the signals behind it reflect actual factory behavior.
Factory Energy Data Readiness Checklist
Before starting an energy AI project, factory teams can ask these questions:
- Do we have hourly or time-block electricity data, including tariff categories such as peak, normal, and off-peak where the local utility uses them?
- Can we separate production loads from office and non-production loads?
- Do we know which zones or lines create peak demand?
- Is compressed air monitored?
- Do we record compressor operating patterns or leakage checks?
- Can we separate heat, steam, or boiler-related energy from general electricity?
- Do we know which machines remain on during idle time?
- Can we connect energy use to production output?
- Do we review energy per output, not only total energy cost?
- Can maintenance, production, and finance use the same energy numbers?
If the answer is no to most of these questions, the factory may not be ready for advanced energy AI yet. That is not a failure. It is a roadmap for improving factory energy data step by step.
Final energy-data takeaway
Factory AI is often discussed as a future technology. But many of the first steps are practical and operational.
Energy is one of those steps. Before a factory can use AI to reduce utility cost, it needs to make energy visible. It needs to know when energy is used, where it is used, why it increases, and how it connects to production output.
Factory energy data is not just a technical layer. It is a management layer. It connects cost, machines, people, schedules, maintenance, and production reality.
The factories that build this layer early will be better prepared for energy dashboards, predictive alerts, smart scheduling, and AI-supported cost reduction later. Factory energy data gives those systems something real to learn from. AI cannot optimize what the factory cannot measure.
External validation anchors for factory energy data
- U.S. DOE industrial efficiency and decarbonization resources — useful for grounding industrial energy improvement in manufacturing-system evidence.
- NIST manufacturing resources — relevant for measurement discipline, process improvement, and data-driven manufacturing systems.