Factory decision note
A garment factory dashboard is useful only when it helps someone act during the shift. Before approving the project, name the decision, the owner, and the time limit. Then decide how the factory will check whether the action worked.
The mistake factories usually make
Teams often start with the screen. They choose charts, colors, and cameras before they agree on the problem. The result may look modern, but supervisors still use phone calls, paper notes, and floor walks to understand what is happening.
What I would check before approving budget
- Which daily decision will use this dashboard?
- Can it separate a normal change from an exception that needs action?
- Does each alert have an owner and a response time?
- Can a supervisor correct wrong data without hiding the original record?
Vendor proof requests
- Show one sewing-line example using output, WIP, quality, SMV, attendance, and material status.
- Explain why each alert appears and who receives it.
- Show the action log and the final result, not only the dashboard screen.
Pilot gate
GO when the dashboard shortens the time from a clear signal to a checked action. HOLD when the data is useful but no one owns the response. REDESIGN when the project produces more charts but does not change the way the factory works.
An AI garment factory dashboard should help a team answer a simple question: What needs attention now? It should connect the records that supervisors already use, including output, WIP, defects, standard time, attendance, material status, and plan changes.
The dashboard should not judge a line from one number. Low output can come from a bottleneck, missing material, rework, machine trouble, a new operator, or an unrealistic SMV. The screen should help the team find the likely cause and check it on the floor.
Start with the decision, not the screen
Ask where the team loses time today. Perhaps a supervisor sees a blocked operation too late. QA may notice the same defect after many bundles are complete. Planning may change the style sequence without updating the line target. These are decision problems. A dashboard can help only if it shows the right signal early enough for the team to respond.
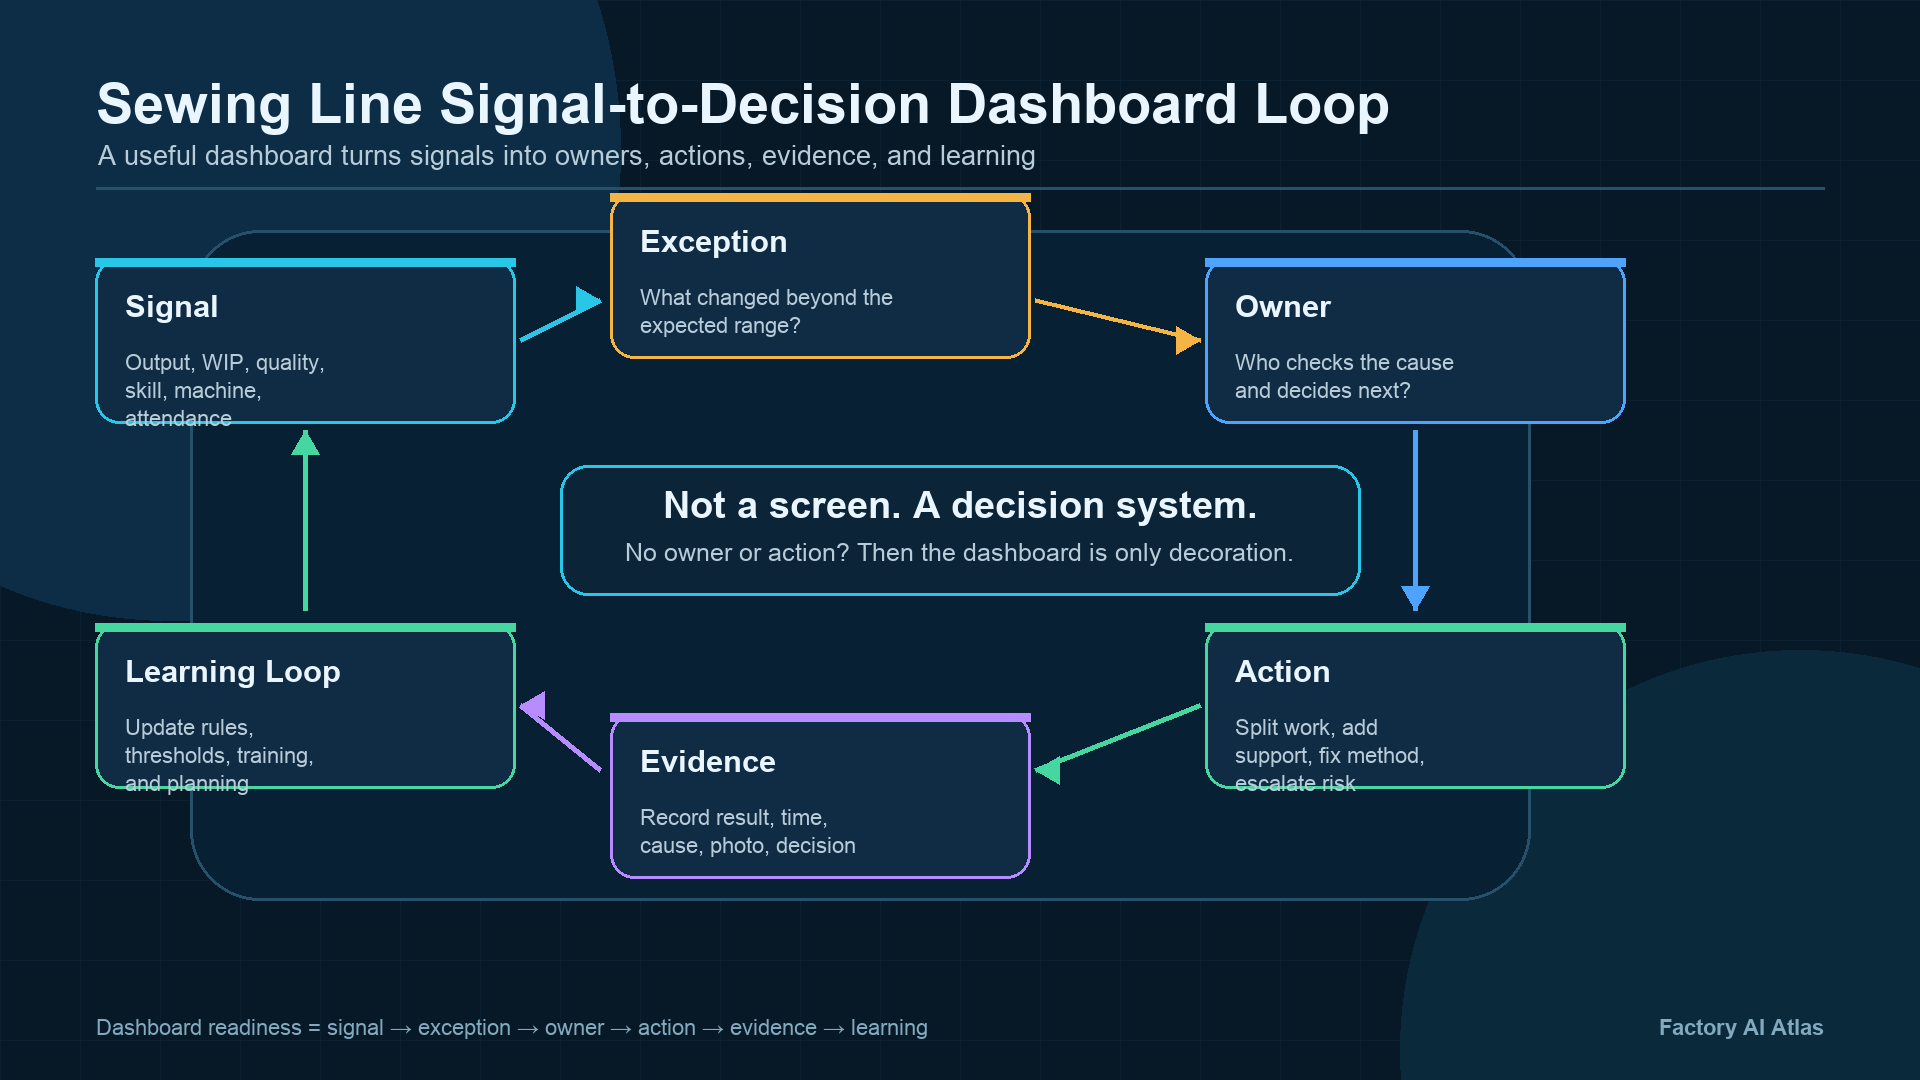
For each use case, write down four items: the signal, the owner, the expected action, and the result check. For example, a rising WIP queue may go to the line supervisor. The supervisor checks feeding, balance, and machine status within 15 minutes. The dashboard then records what changed and whether the queue fell.
This is different from a normal KPI report. A report gives management a past result. An operating dashboard helps the floor team decide what to do next.
Connect five groups of factory signals
No single metric explains line performance. The first version does not need every factory system, but it should connect enough context to avoid a false answer.
1. Line flow and WIP
Track where work is waiting, not only the total WIP. A high queue before one operation and an empty queue after it may point to a bottleneck. The team should also see missing bundles, feeding delays, and work held for approval. End-of-day totals are too late for same-shift recovery.
2. Quality and rework
Place quality beside output. Show the main defect, the operation where it appears, the affected bundle or lot, and the repair load. A line can meet its quantity target while creating extra repair work. The dashboard should make that trade-off visible before the endline becomes crowded.
3. SMV and method
Efficiency depends on the time standard. If the SMV is old or based on a different method, the dashboard can blame the wrong team. Keep the approved SMV version, machine type, attachment, method change, and learning curve with the line result. The GSD, SAM, and SMV data layer explains why this record needs control.
4. People and skills
Headcount alone is weak context. One missing operator at a critical operation may affect the full line. A replacement may need more time or support. Connect attendance with operation skill, backup coverage, and the current style. Use this information to support the supervisor, not to score workers without context.
5. Plan and material readiness
Sewing results often reflect an upstream problem. The line may be waiting for cut parts, trims, shade approval, or a revised plan. Show material holds, cut input, style changes, and shipment priority beside line performance. This keeps the dashboard from calling every delay a sewing problem.
Show supervisors what they can act on
A supervisor does not need every number on one screen. The main view should show the current gap, the likely reason, the evidence behind that reason, and the next check. Details can sit on a second screen.
A practical line view may include:
- current output, target basis, and WIP around the bottleneck;
- the main defect and current repair load;
- the approved SMV and any method change;
- absence or skill coverage at critical operations;
- material holds and recent plan changes;
- the person handling the exception and the next review time.
AI may help compare these records and suggest where to look first. It should show the supporting data and allow the supervisor to reject a weak suggestion. Cameras and machine sensors can add useful signals, but they cannot explain a buyer change, a mixed-size bundle, or an unofficial method change on their own.
NIST describes smart manufacturing as connected production systems that use information across the operation. Its work on smart manufacturing and cyber-physical systems supports the need to connect physical events with digital records. In a garment factory, the supervisor’s floor check remains part of that connection.
Define the data before adding AI
Two departments may use the same word and mean different things. QA may count a repaired piece as output, while production may count only first-pass pieces. IE may use one SMV version while planning uses another. A dashboard built on these differences will create arguments.
Before adding AI, agree on basic rules:
- What counts as good output?
- When and where is WIP counted?
- How are defects, repairs, and rejects recorded?
- Which SMV version is official?
- How are downtime and waiting time classified?
- Who can change the plan or correct a record?
Start with the records that operators and supervisors already touch. The guide to garment factory data foundations gives a practical starting point. Do not add a new form unless it replaces work or helps a real decision.
Pilot one workflow on one line
A small pilot is easier to judge than a factory-wide dashboard. Choose one line, one style family, and one repeated problem. Use data that the team already understands.
- Write the decision rule. State the signal, owner, action, response time, and result check.
- Connect only the needed records. Start with output, WIP, quality, SMV, attendance, and material status if they explain the chosen problem.
- Review the signal with the supervisor. Check whether the alert matches floor conditions.
- Record wrong alerts. A false alert is useful pilot evidence. It shows where the rule or data needs work.
- Compare before and after. Measure response time, repeated exceptions, repair load, or another result tied to the decision.
Do not scale because the screen looks good in a meeting. Scale after the same workflow works across different shifts and normal production changes. Many automation projects struggle because the factory buys technology before it understands the process. The article on why garment factory automation is difficult covers this problem in more detail.
Verify the result after the action
An alert is not proof that the problem was solved. The factory needs a short action record: what the system showed, what the supervisor found, what action was taken, and what the line looked like afterward.
This record also helps the team find bad logic. If the dashboard often recommends balancing when the real issue is missing trims, the factory should correct the rule before adding more lines. If the data is uncertain, the screen should say so rather than show a confident answer.
The Factory AI Action Assurance guide explains the next layer. The dashboard provides the signal. Action assurance checks permission, tool use, final state, human review, and rollback before an AI-assisted action is treated as complete.
Sources and limits
This article is an operating framework, not a performance claim for a product. The right metrics and response times depend on the factory, style, data quality, and management process. A pilot should test the dashboard under real production changes before the factory relies on it.
Final factory check
A useful garment factory dashboard does three things well. It shows a problem early, sends it to the right person, and records whether the response worked. If the project cannot do those things on one line, adding more sensors or charts will not fix it.
Keep the first pilot narrow. Use clear data rules. Let supervisors challenge the signal. Then scale only the parts that help the factory respond faster without hiding quality, material, method, or staffing problems.